
Creating Home IT Monitoring with checkmk
My home has a lot of computers and other devices on the network. To the point where I decided to set up some monitoring infrastructure.
This is partly a precursor project to building a home cluster. I wanted to get a sense of how stable the different devices were and was wondering what sort of capabilities would be easy to set up.
It took me a little while to figure out what my goal was. I could go the custom route and set up a server and database from scratch, but I wanted something that would be relatively turn key and let me get an overview of the machines on my network without needing to do a lot of bespoke configuration. At a minimum I wanted uptime and resource usage.
One of my initial goals was remote access, but this seems to be it’s own separate set of problems. After looking into it a bit I decided to keep using the combination of chrome remote desktop and SSH.
Choosing a Monitoring System
There are a lot of products in this space with a wide set of features. I wanted something with the following features:
- Could be run entirely on my LAN without a cloud connection
- Could monitor Windows, Mac, Linux out of the box
- Could monitor routers and devices that only expose HTTP APIs
- Ideally open source for at least some components
After looking around a bit I decided to go with checkmk which is built on top of the fully open source Nagios. It was the first tool I tried, and while it is definitely not perfect, it fit my needs well enough once I figured out its quirks.
Setting up checkmk
checkmk appears to have really good documentation. I said “appears” because they recently transitioned to a 2.0 release and basically all their documentation was out of date. All the ideas are basically the same, but different enough to require a decent amount of detective work to actually get things working.
The heart of checkmk is an installer for a linux system that sets up the databases and web servers that make up the application.
My first problem is that the server I chose to host checkmk on already had a different webserver. The checkmk installer kind of just tried to install over it, and I ended up manually needing to clean up the /var/www directory and change the port the other serer was using.
The next thing I needed to wrap my head around was the checkmk concept of “sites”. Basically, the checkmk tools allow you to run multiple instances on the same server. In practice this meant I needed to do the extra set up to get the initial site up and running. While the documentation was a bit out of date, the installer itself, had good instructions baked in, and the CLI tools were good at providing useful help output. Here’s what I ended up doing:
1
2
3
4
5
6
7
8
9
10
11
12
# omd is the CLI tool for configuring checkmk
# this initial command creates my new site oakdiamond
sudo omd create oakdiamond
# most of the omd sub-commands take the site as an argument
# this command let's you log in as the user that controls
# the site and makes subsequent commands use the correct site
sudo omd su oakdiamond
# the only initial configuration I did was set this config parameter
# to allow the other computers on the LAN to access the web GUI
omd config set APACHE_TCP_ADDR 0.0.0.0
# the site needs to be started to be accessed.
omd start oakdiamond
It also took me a bit to figure out that I needed to access the web GUI through the URL:
http://SERVER_NAME:5000/SITE_NAME/check_mk
Though this can be changed by modifying the Apache config through the omd command.
Getting Monitoring Set Up On PCs
For the rest of the set up, I relied on the web GUI. I found it took me awhile before I understood the core concepts of how the tool was organized, before I was able to effectively find anything without trying a dozen links. The GUI is really nice in that it provides search functionality, but that doesn’t help when you don’t know the key word you should be looking for.
To get robust monitoring for a PC or server, you need to install the Check_MK agent on the machine you want to monitor. Links to installers can be found in this section:
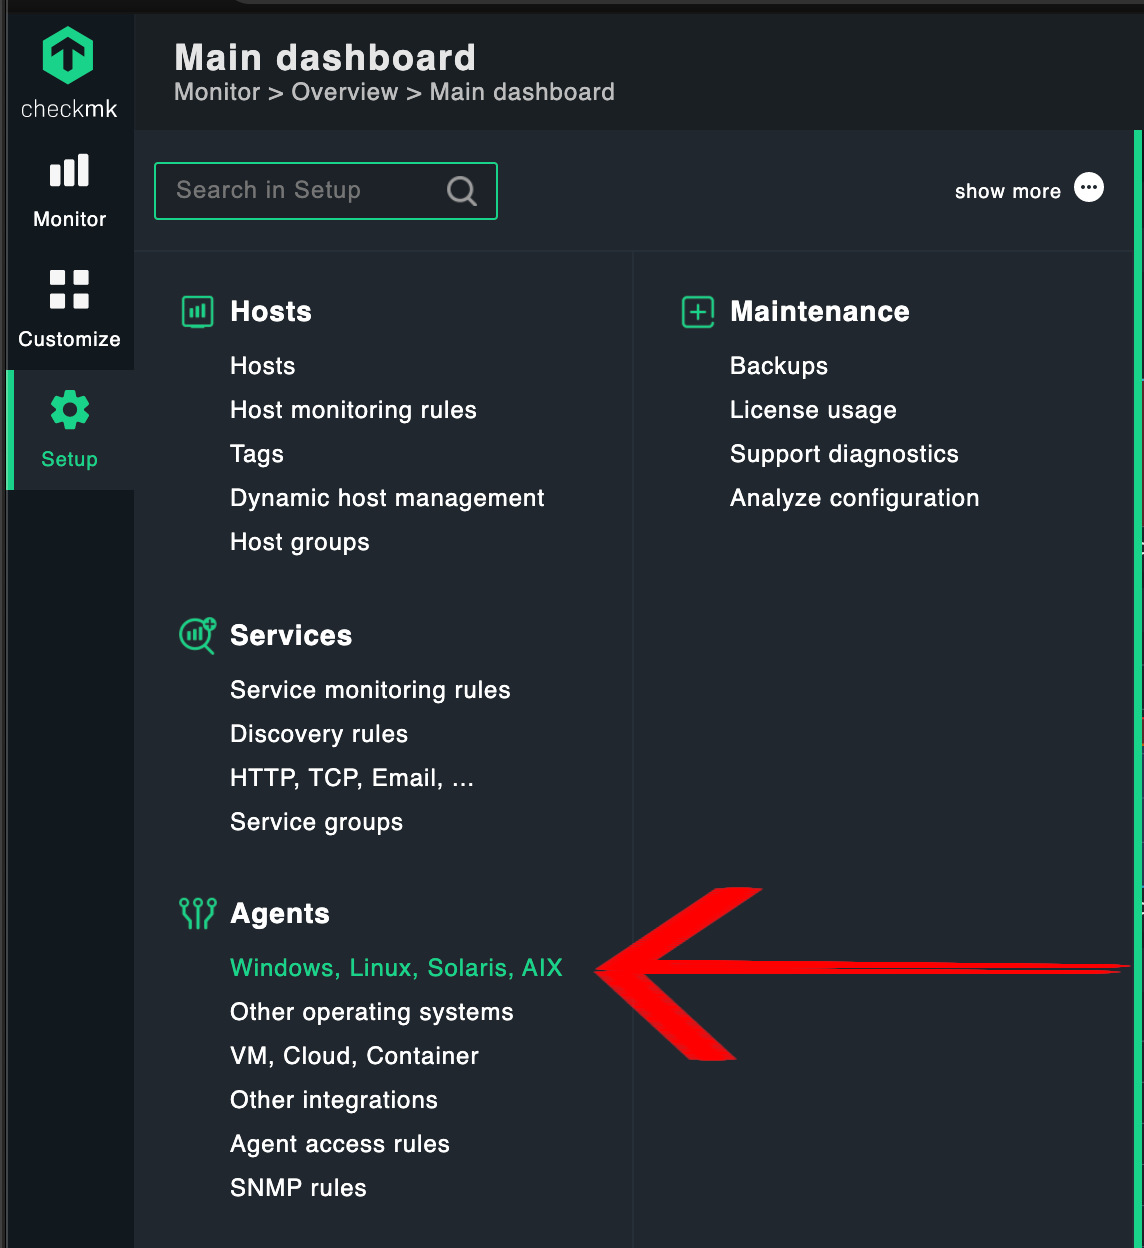
This took especially long to find since the search function doesn’t show this if you search for agent.
With the installers set up was fairly straight forward on Linux and Windows, but I had to follow a sketchy script to get it working for MacOS https://gist.github.com/catchdave/44c45e31951fcc9ee4fb8768f4d95f21.
How Monitoring is Organized
Another thing that took me a bit to understand was how the following concepts were organized.
- Hosts - The “devices” that are being monitored. Typically these map to the devices running the Check_MK agent or that have some other metrics interface like SNMP.
- Services - The concept of services are a little less well defined. The definition provided in the documentation is fun…
A host has a number of services. A service can be anything - please don’t confuse this with services in Windows. A service is any part or aspect of the host that can be OK, or not OK.
In writing this article I found the page https://docs.checkmk.com/latest/en/monitoring_basics.html which actually gives a decent overview.
What makes this more complicated is how to actually specify the host and services you’re trying to monitor.
The hosts are basically just specified as IP addresses. What gets complicated is that the services for the most part are specified as “Discovery Rules” rather then explicitly configured. Basically, there are a set of rules that are run against each host in the system. Things like ping a URL, or look for a name in the process list. These rules can be made to only run on certain hosts, or groups of hosts.
Once a service is discovered you can set them to either be monitored or disabled. It’s this list of hosts, and the enabled services that give you the metrics that you’ll end up monitoring.
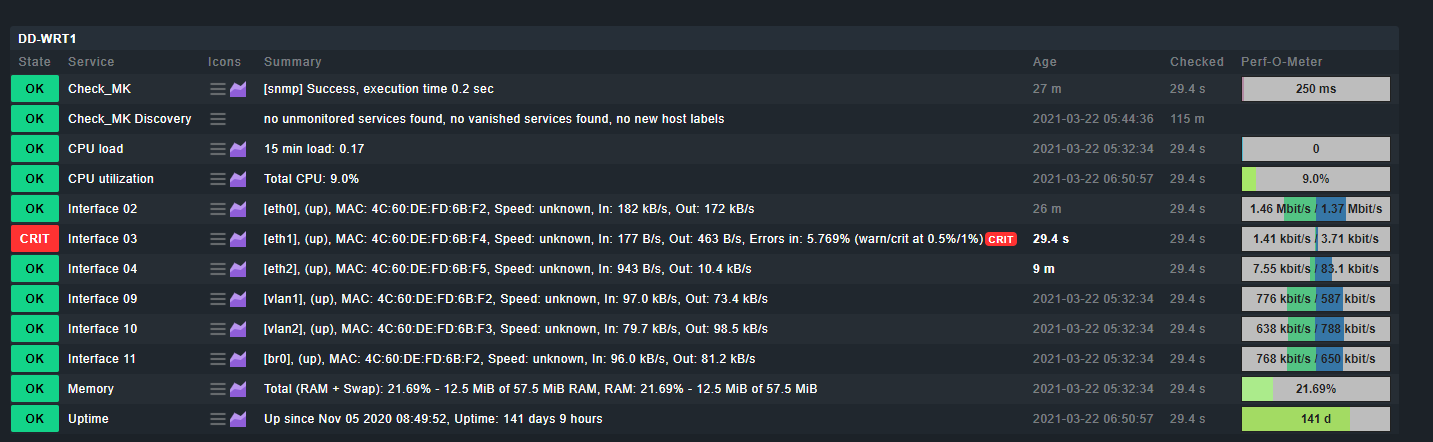
For example here’s a list of services for my router:
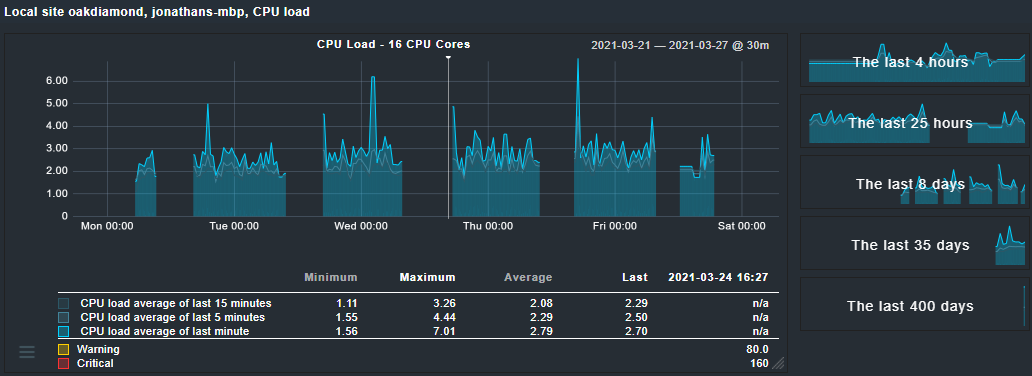
For the services that are tracked with a number you can get plots like the CPU usage for my laptop:
There’s a ton of configurability to allow you to organize the dashboards, and set up more sophisticated notifications, but I’m going to focus on how I set up monitoring for the devices in my home that can’t run a Check_MK agent.
SNMP
This was a blast from the past. SNMP protocol for monitoring a device on a network https://en.wikipedia.org/wiki/Simple_Network_Management_Protocol. I can’t remember what I tried to do with SNMP in the past, but I remember it frustrating me as someone who hadn’t really dealt with networking before. This time around it was a very different result.
To add a SNMP device, you need to change the settings in the host to include the SNMP credentials and disable the normal agent. Once I figured that out it just auto-magically worked for all the SNMP devices on my network. I was able to get rich diagnostics from my routers and from my printer of all things. I guess this is the power of “enterprise” software.
I could now see the memory usage and remaining ink percentage from my printer.
I also get to feel vindicated for the effort I went through setting up my DD-WRT firmware on my routers since this is an included feature. Of course our one closed source router is basically unmonitorable.
I would consider adding a SNMP functionality to future projects after seeing it in action like this.
Monitoring Cloud Devices
After SNMP I figured the slick cloud enabled devices in the house would be a snap as well. That as where I was totally wrong. The main devices I wanted to monitor were:
- Nest Thermostats
- Roomba Vacuum
- Reolink Security Camera
None of these have official LAN accessible API’s. Each one requires some sort of reverse engineering effort.
I thought I’d be able to get something quick and dirty up and running, but apparently the slicker the IoT device the worse it is to have any level of control over that doesn’t go through an app. I’ll do some follow ups on trying to get direct access to these devices.
My plan is to create an Active Check plugin that lets the server query the data I want from the device to monitor.
See these follow up articles!
- Roomba Python API with checkmk
- Reolink Python API with checkmk
- Creating a Library for Google Nest API Monitoring
Conclusion
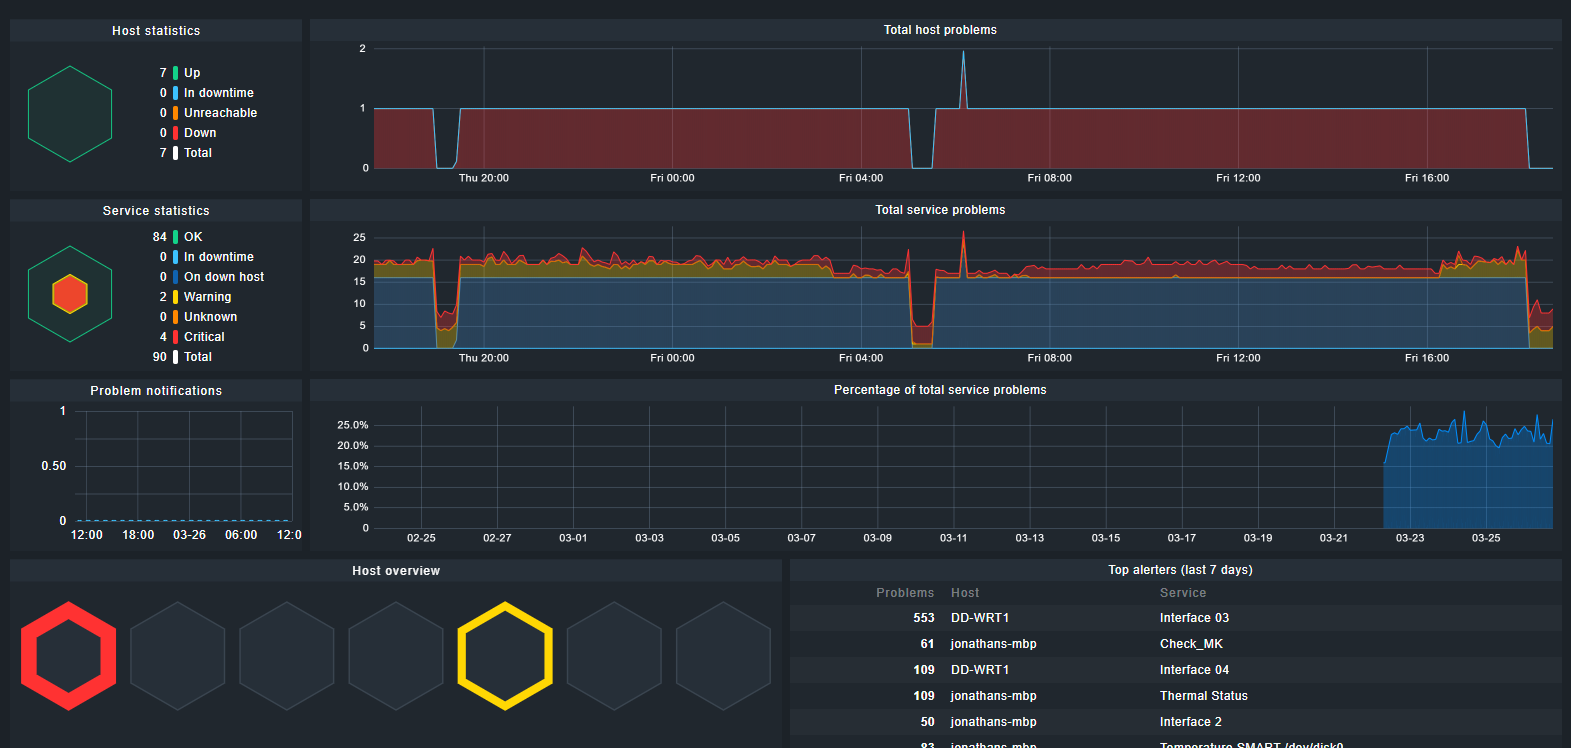
After playing around a bit, I’m pretty happy using this as a tool in my belt for managing the computers in my house. I was able to detect that one of my servers was burning a ton of CPU on a defunct project, and also learned my main router periodically has a ton of errors on the ethernet connection that get distributed through the house. I could spend some time making some informative dashboards, but honestly it pretty much achieved my goal without much tweaking.
The one thing that was less then ideal is that monitoring doesn’t really handle computers going to sleep very well. Initially it would continuously wake up my PC over ethernet until I disabled that in the ethernet properties. With the computer asleep it shows up as a big red spot in the metrics and adds a lot of noise to the monitoring. You can filter it out OK, but the tool is not made to handle this use case well. You can mark a host for scheduled down time, but I think I’ll just live with my network looking unhealthy and ignoring the periodic errors on my PC’s.